What gets measured gets done: Certification Dashboard
I empowered leaders to monitor employees’ progress on certification exams, resulting in 76k unique visitors from prominent companies like AWS, Google Cloud, Azure, CompTIA, and Tableau within the first month.
Overview & Challenge
I spearheaded the development of a data-driven dashboard for admins and managers to track employees’ certification progress, enhancing transparency and efficiency in the certification journey for learners and leaders.
Pluralsight emphasizes meeting learners at their stage in the learning journey, and began offering certification vouchers to companies for skill validation. However, the surge in demand revealed a challenge: the lack of progress visibility led to financial losses from unused vouchers, and leaders were unaware of certification exam results, hindering promotions for deserving candidates.
Summary & Outcomes
Conducted research by interviewing administrators, managers, and employees to identify each personas specific data needs and comfort in sharing personal information.
Ideated, creating journey maps and wireframes for efficient data comprehension, aiding leaders in understanding the strategy of the dashboard.
Collaborated closely with my product manager partner to establish success criteria and maintained regular communication to provide design updates. Developed and tested Figma prototypes, synthesizing feedback to improve designs iteratively.
Offered guidance to the engineering team to ensure the implementation of pixel-perfect user experiences.
Drove 76k unique visitors from AWS, Google Cloud, Azure, CompTIA, Tableau, to the dashboard within the first month, resulting in significant savings for companies by reducing unredeemed certification vouchers.
Interviews
Developed guides and conducted interviews to identify crucial data required by leaders to intervene early in learners’ certification preparation if they were falling behind. Balancing concerns between data transparency and employee privacy, we were pleased to discover that employees were more willing to share their progress with leaders than we initially anticipated, in large part because the exams were company-sponsored.
Journey Map & Wireframes
After developing a user journey map detailing the information accessible to user personas at each stage of the certification process, I designed wireframes that were presented to stakeholders and users for feedback. This ensured that we could effectively display the data we had planned and address any potential usability issues early in the process.
This timeline depicts when each user receives information during the certification voucher journey.
Success Criteria
Objective: Enhance transparency and efficiency in supporting employees’ certification journeys.
Key Results:
1. Increase leader visibility into certification voucher redemption, certification preparation and exam results by 80%.
2. Reduce inefficiencies in project allocation related to certification status verification by 50%.
3. Increase admin and manager engagement in certification preparation by driving users to the dashboard, resulting in 50k unique visitors to the dashboard within the first quarter.
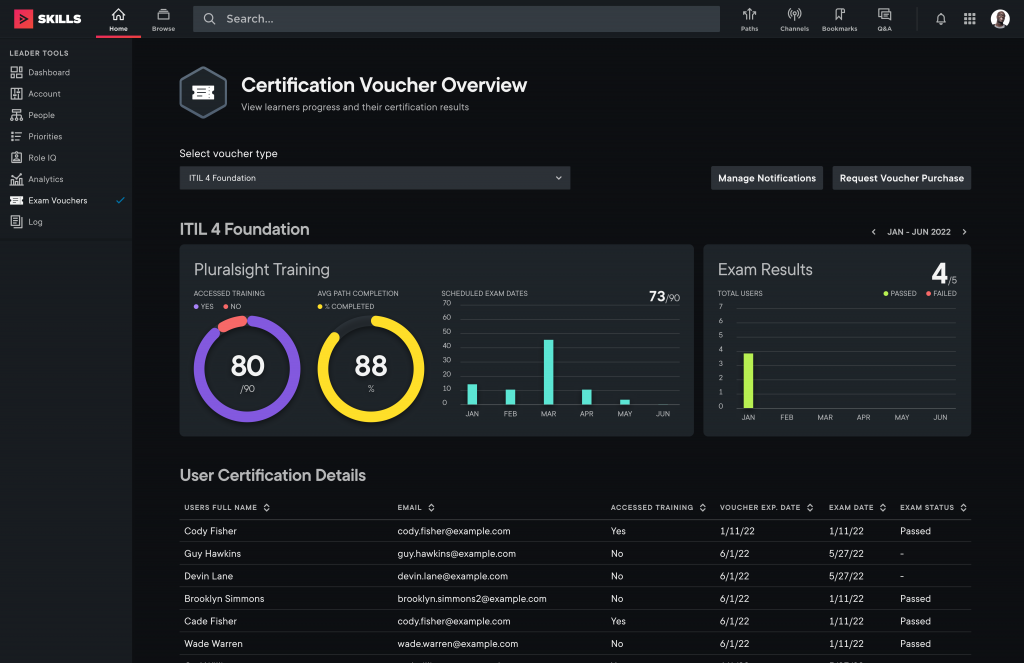
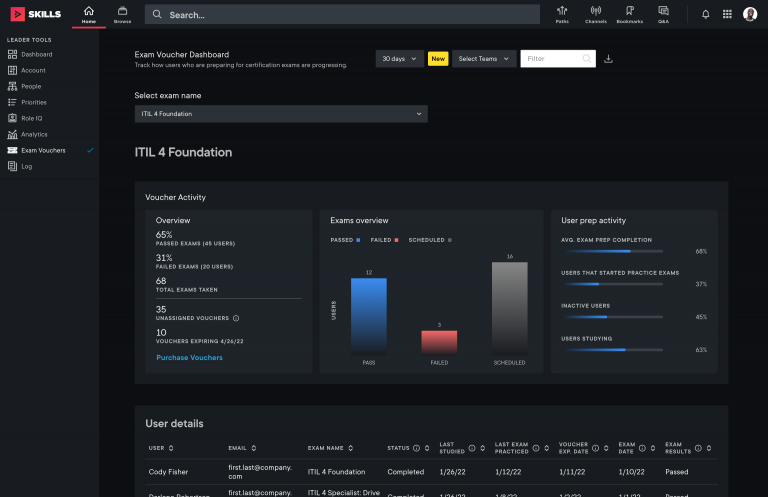
User Testing & Iterations
Following the creation of multiple designs, we conducted user testing to determine the most effective presentation of the learner’s certification journey. We found a preference among leaders for visual representations of progress within their organizations. In response, we integrated charts and graphs to visually communicate learners’ progress, aligning with stakeholders’ preferences and enhancing the overall user experience.
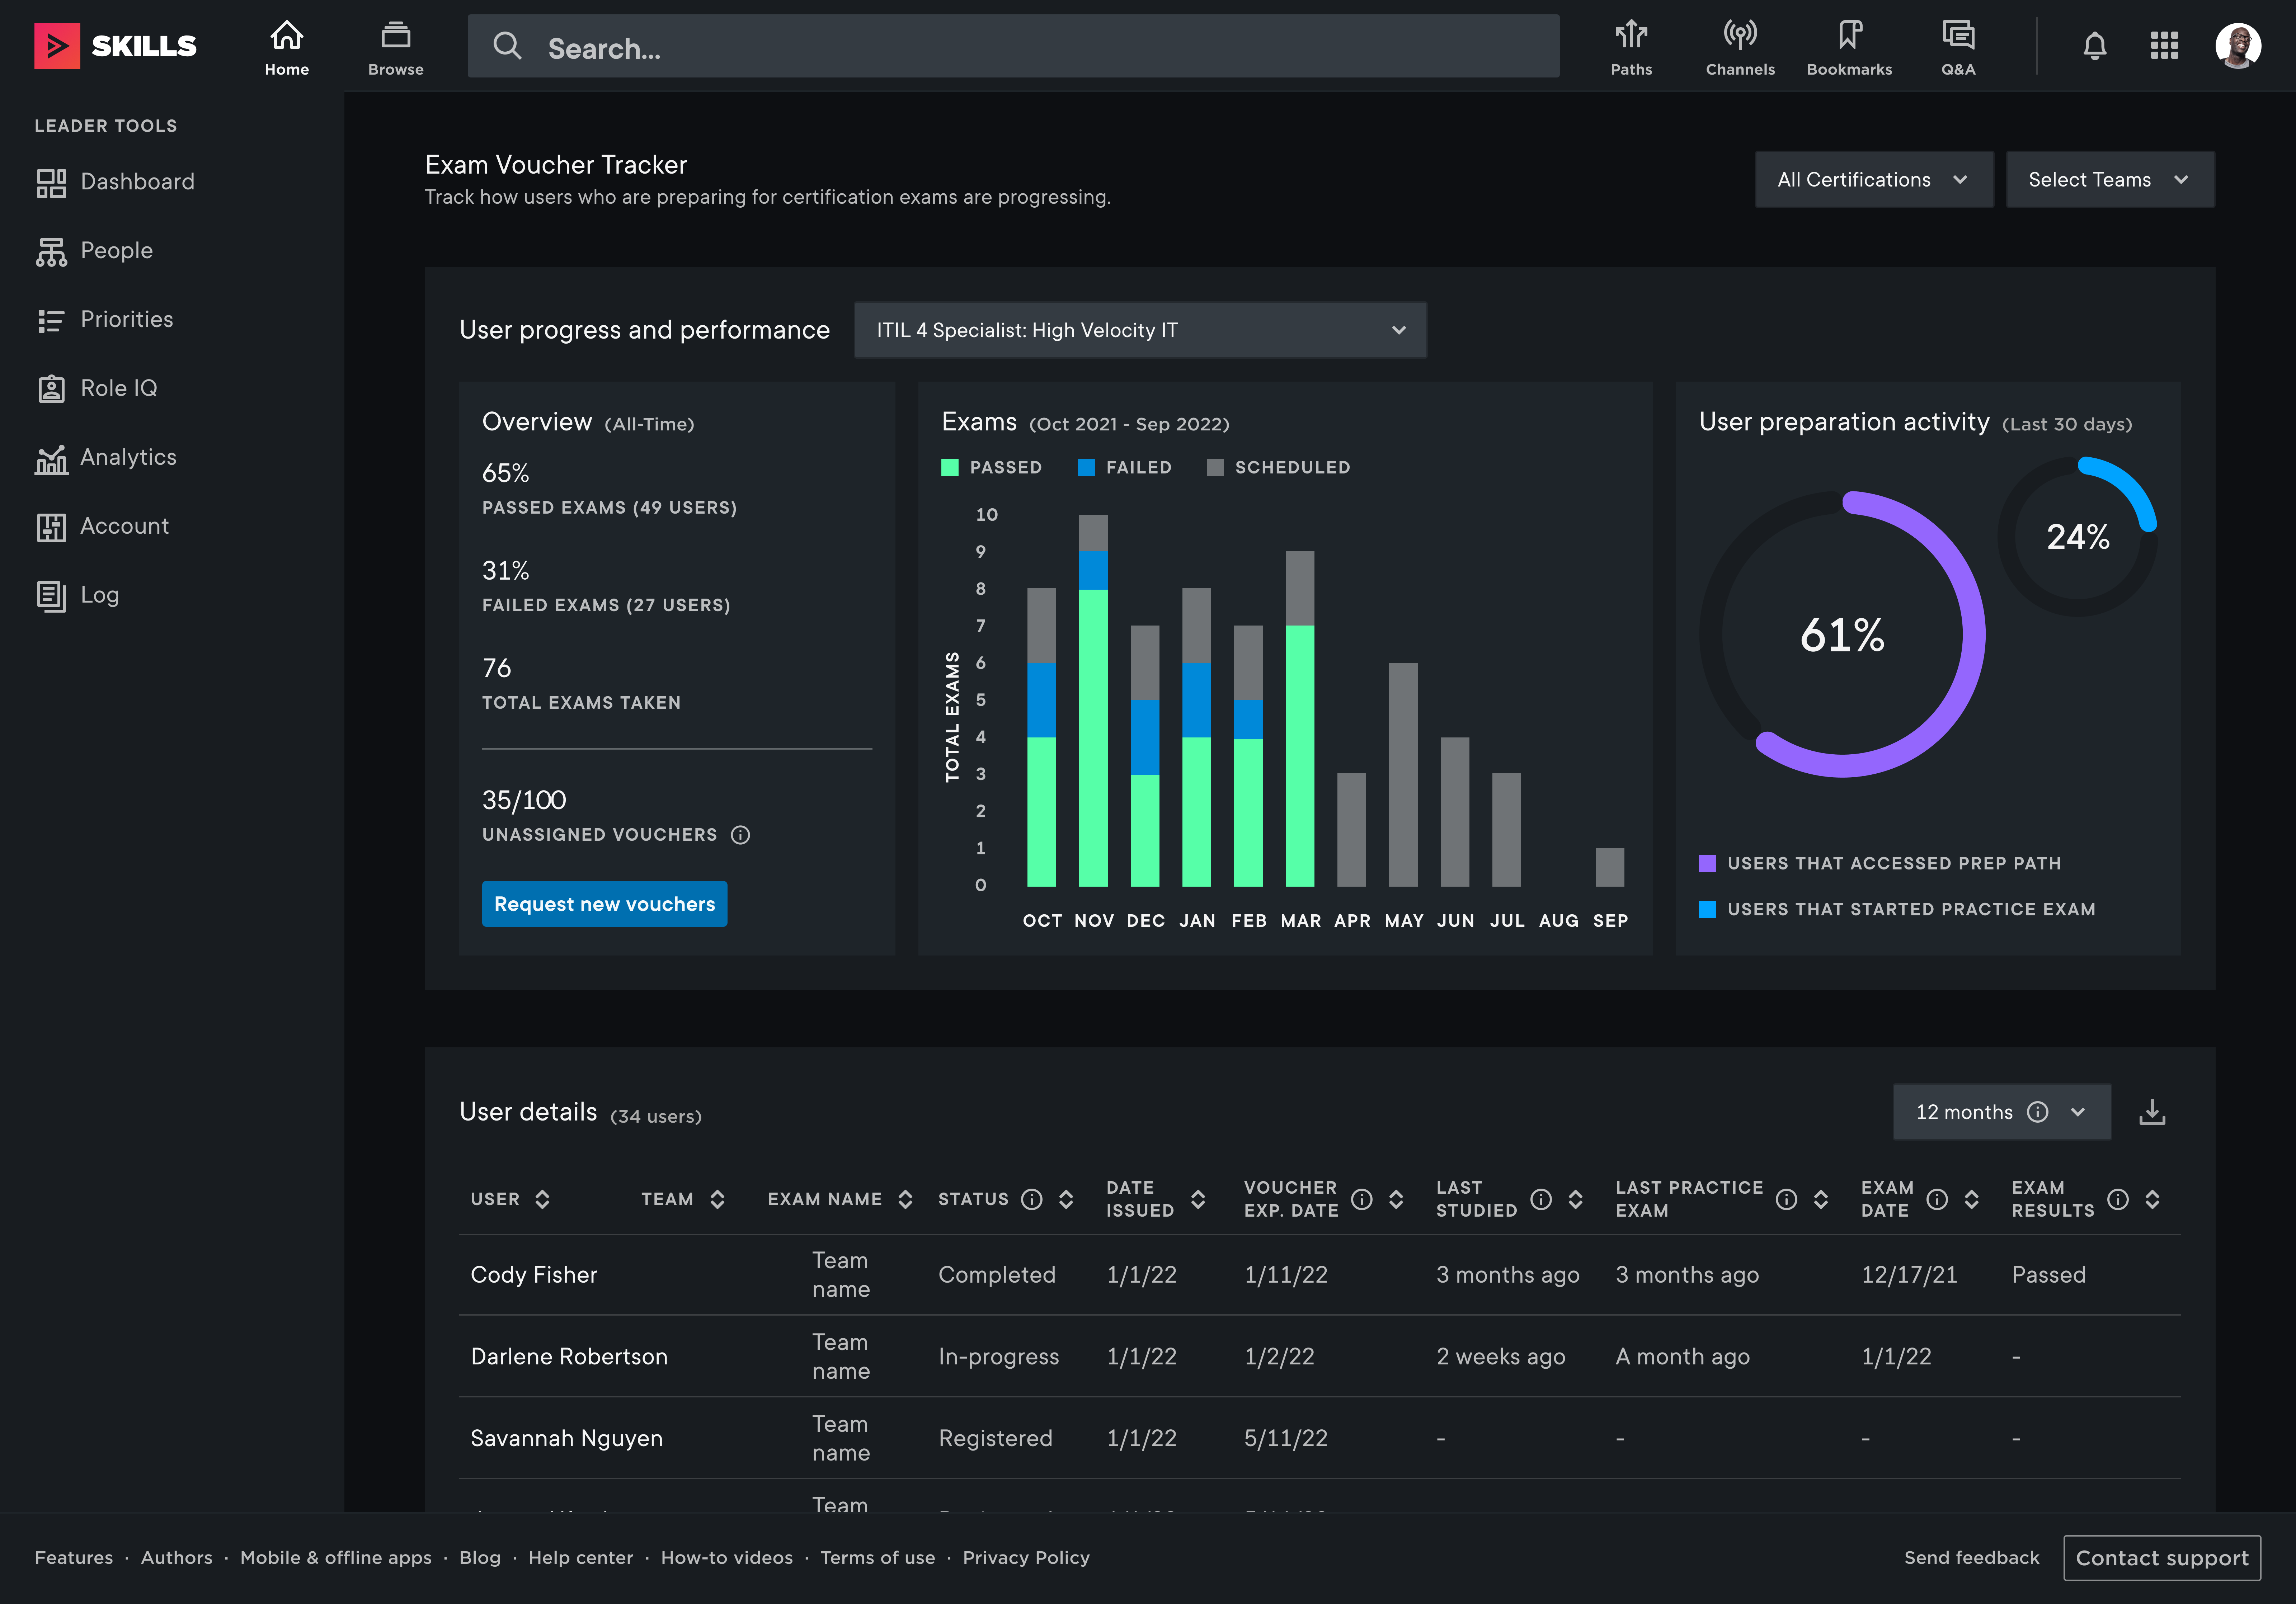
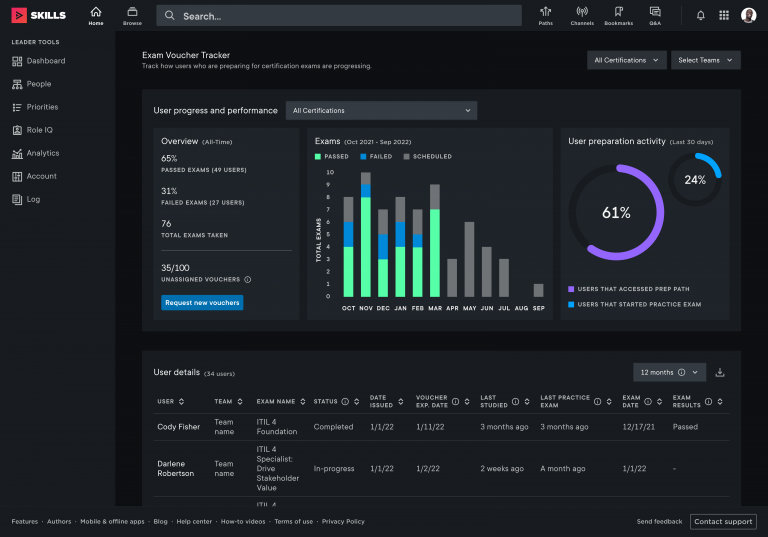
Final Design
After multiple rounds of iterating and testing, we were able to release the dashboard as a leader tool on Pluralsight (only viewable to leaders and admin). After the release, we received a lot of excited feedback from admin finally being able to track the certification journey. We were also able to see a drop in unredeemed voucher expiration.